
Introducing Oilytics 2.0: Creating the Next Generation Data Analytics Platform
Nearly 2 years ago, I wrote my first LinkedIn post documenting my journey as an analyst to a start-up founder. A start-up journey is normally full of rollercoasters but adding COVID19 to the mix felt like a giant unexpected loop. Not being to able meet clients and prospects was a challenge but it gave the team time to step back, put our heads down, and continue building after speaking to many key stakeholders.
The platform has come a long way from the prototype created nearly 2 years ago. And, we are just getting started!
Now vs Then
Now vs Then
So what is Oilytics 2.0? Without sounding cliché and trying to avoid the buzzwords, we break down Oilytics into 6 major themes and what we think it does best. If you have don’t have time to read below, this 30-second clip showcases some of our platform’s features.
Simplification
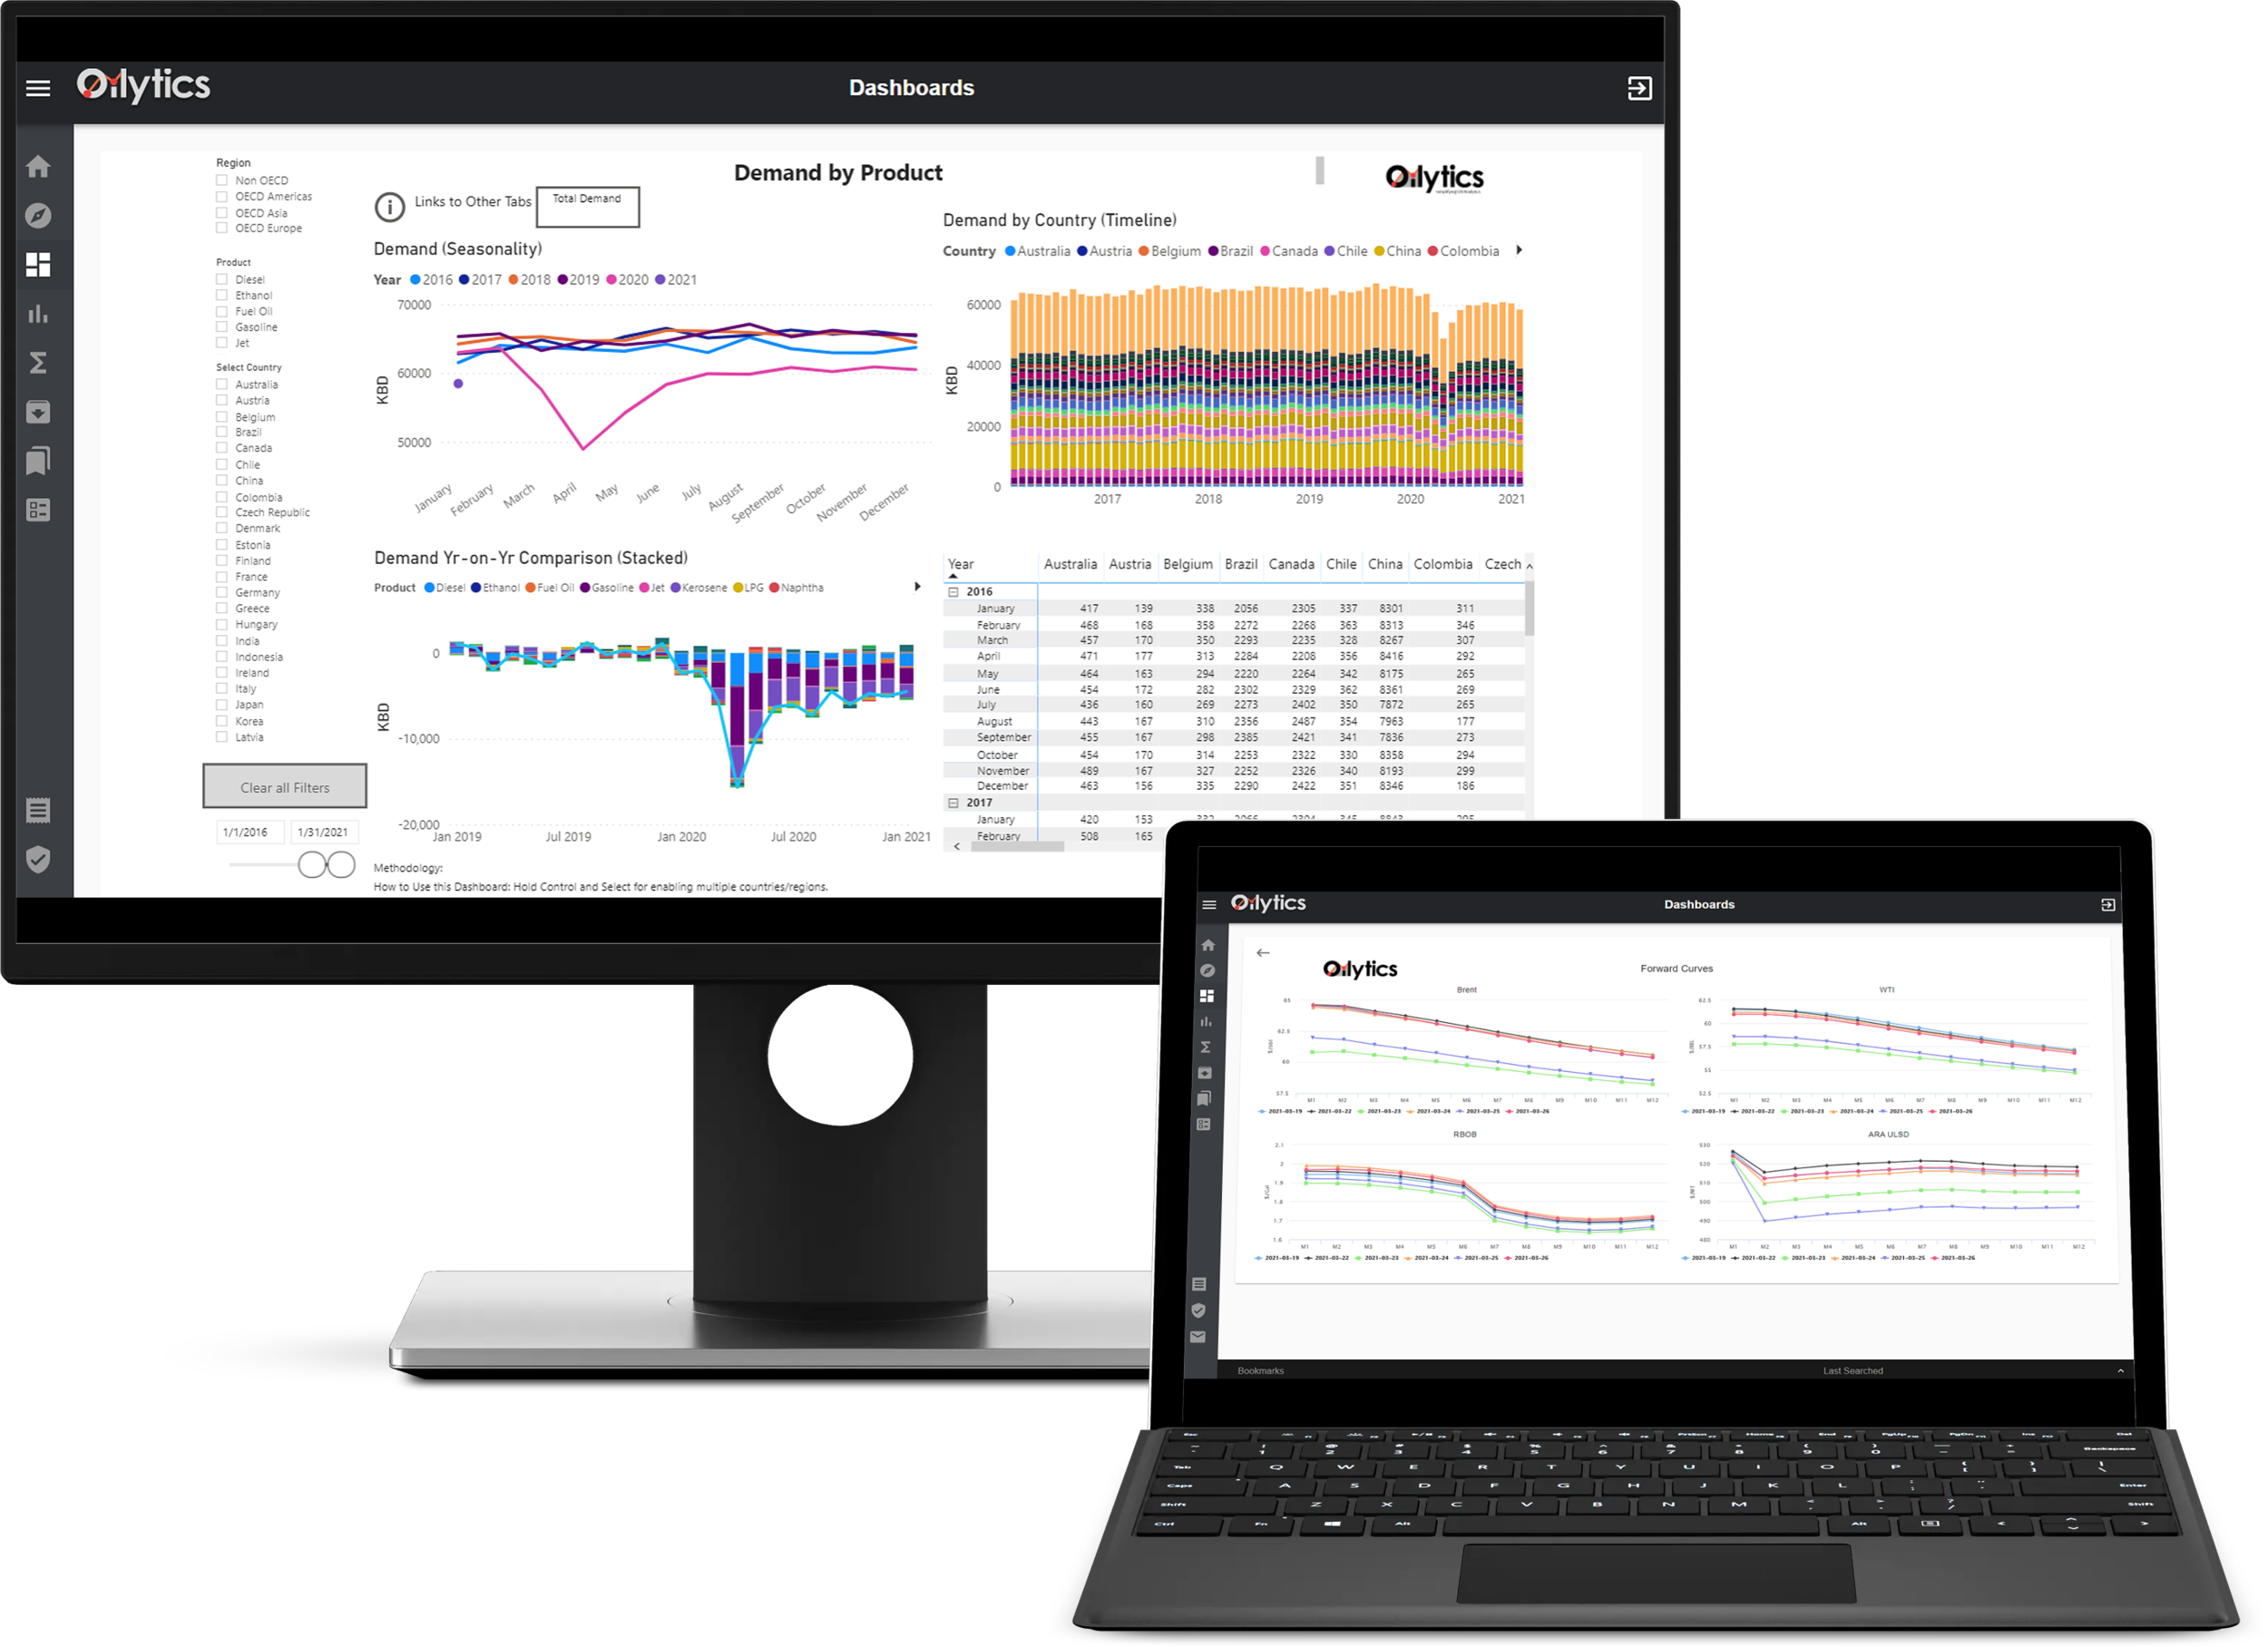
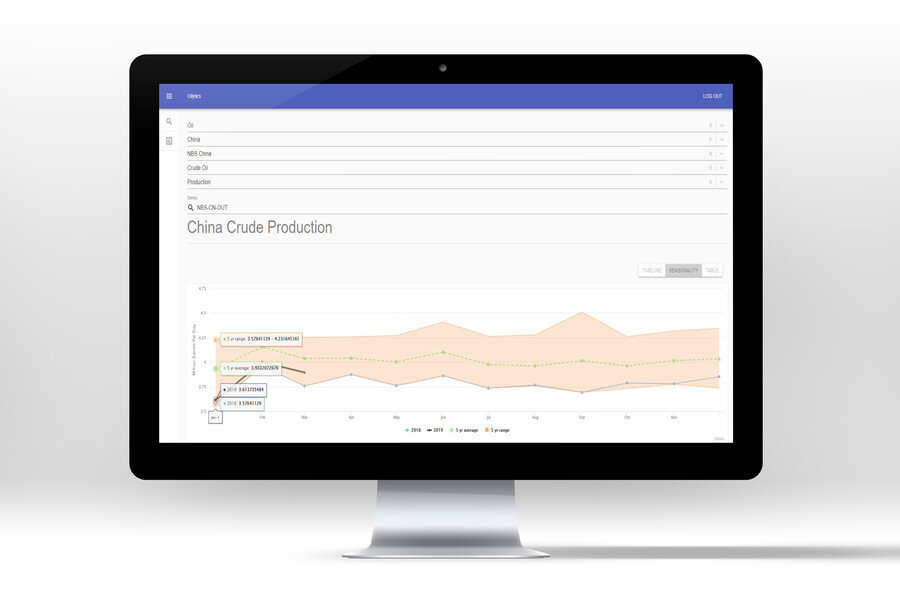
This has been our goal from day 1, but it has been ridiculously hard to implement due to the oil market’s complexity. However, we can now proudly say that any user can access any dataset or dashboard on our website in 5 clicks and less. No need to remember codes for accessing datasets anymore, the user interface is as intuitive as it gets. Whether it’s Chinese crude imports, Daily Commercial Flights, Jun-Dec Brent, or European refinery margins, it’s all accessible in seconds.
Curation
We’ve all heard the common phrase “data is the new oil”. However, similar to data, oil is useless on its own if not refined. We strive to solve the data overload problem for our clients. Every data point in our platform is categorised for our users to make sense of. For example, our global oil demand tracker automatically updates data from multiple various sources and gives users a country/regional/global view.
Automation
All our datasets are updated automatically. A lot of time, money, and energy is wasted across the industry updating the same datasets. In our platform, whether it’s a daily, weekly, monthly, or quarterly dataset, you will always find the most up-to-date data.
Content
We are adding curated dashboards at an extremely fast pace. We had started off with fundamental data, but we also have prices, positioning, macro, and relevant non-oil datasets. COVID19 has unleashed many new datasets and this trend is only going to accelerate. Follow our company’s LinkedIn page to stay updated for new datasets and dashboards.
Speed
From Abu Dhabi to Zug, our platform operates seamlessly around the world. Our web-based platform does not get the “not responding” Excel error when handling >100MB files. Our company’s biggest costs are cloud-based servers and we plan to keep it that way and invest more as we ingest more data.
Daily Newsletter
We started the Oilytics Daily Market Report a few months ago as an add-on service and have been pleasantly surprised by the word of mouth within the industry. We think data-driven newsletters are just getting started. Our daily newsletters, which is read by trading houses, curates the relevant charts from our platform and added with my market views. For the best experience, users of the web platform and the daily report can access interactive charts within the platform while they read the daily report. You can find a sample report here.
As the world slowly returns to a new normal, we look forward to our continuous development and keep people posted. If you would like a trial of the platform and/or the daily newsletter please contact us below.